Core Method
Data visualization for real people
Common Scenarios
Dashboards locked into the limits of a rigid BI tool
Charts scattered across products with no cohesive visual strategy
Interfaces reduced to spreadsheets instead of living experiences
:
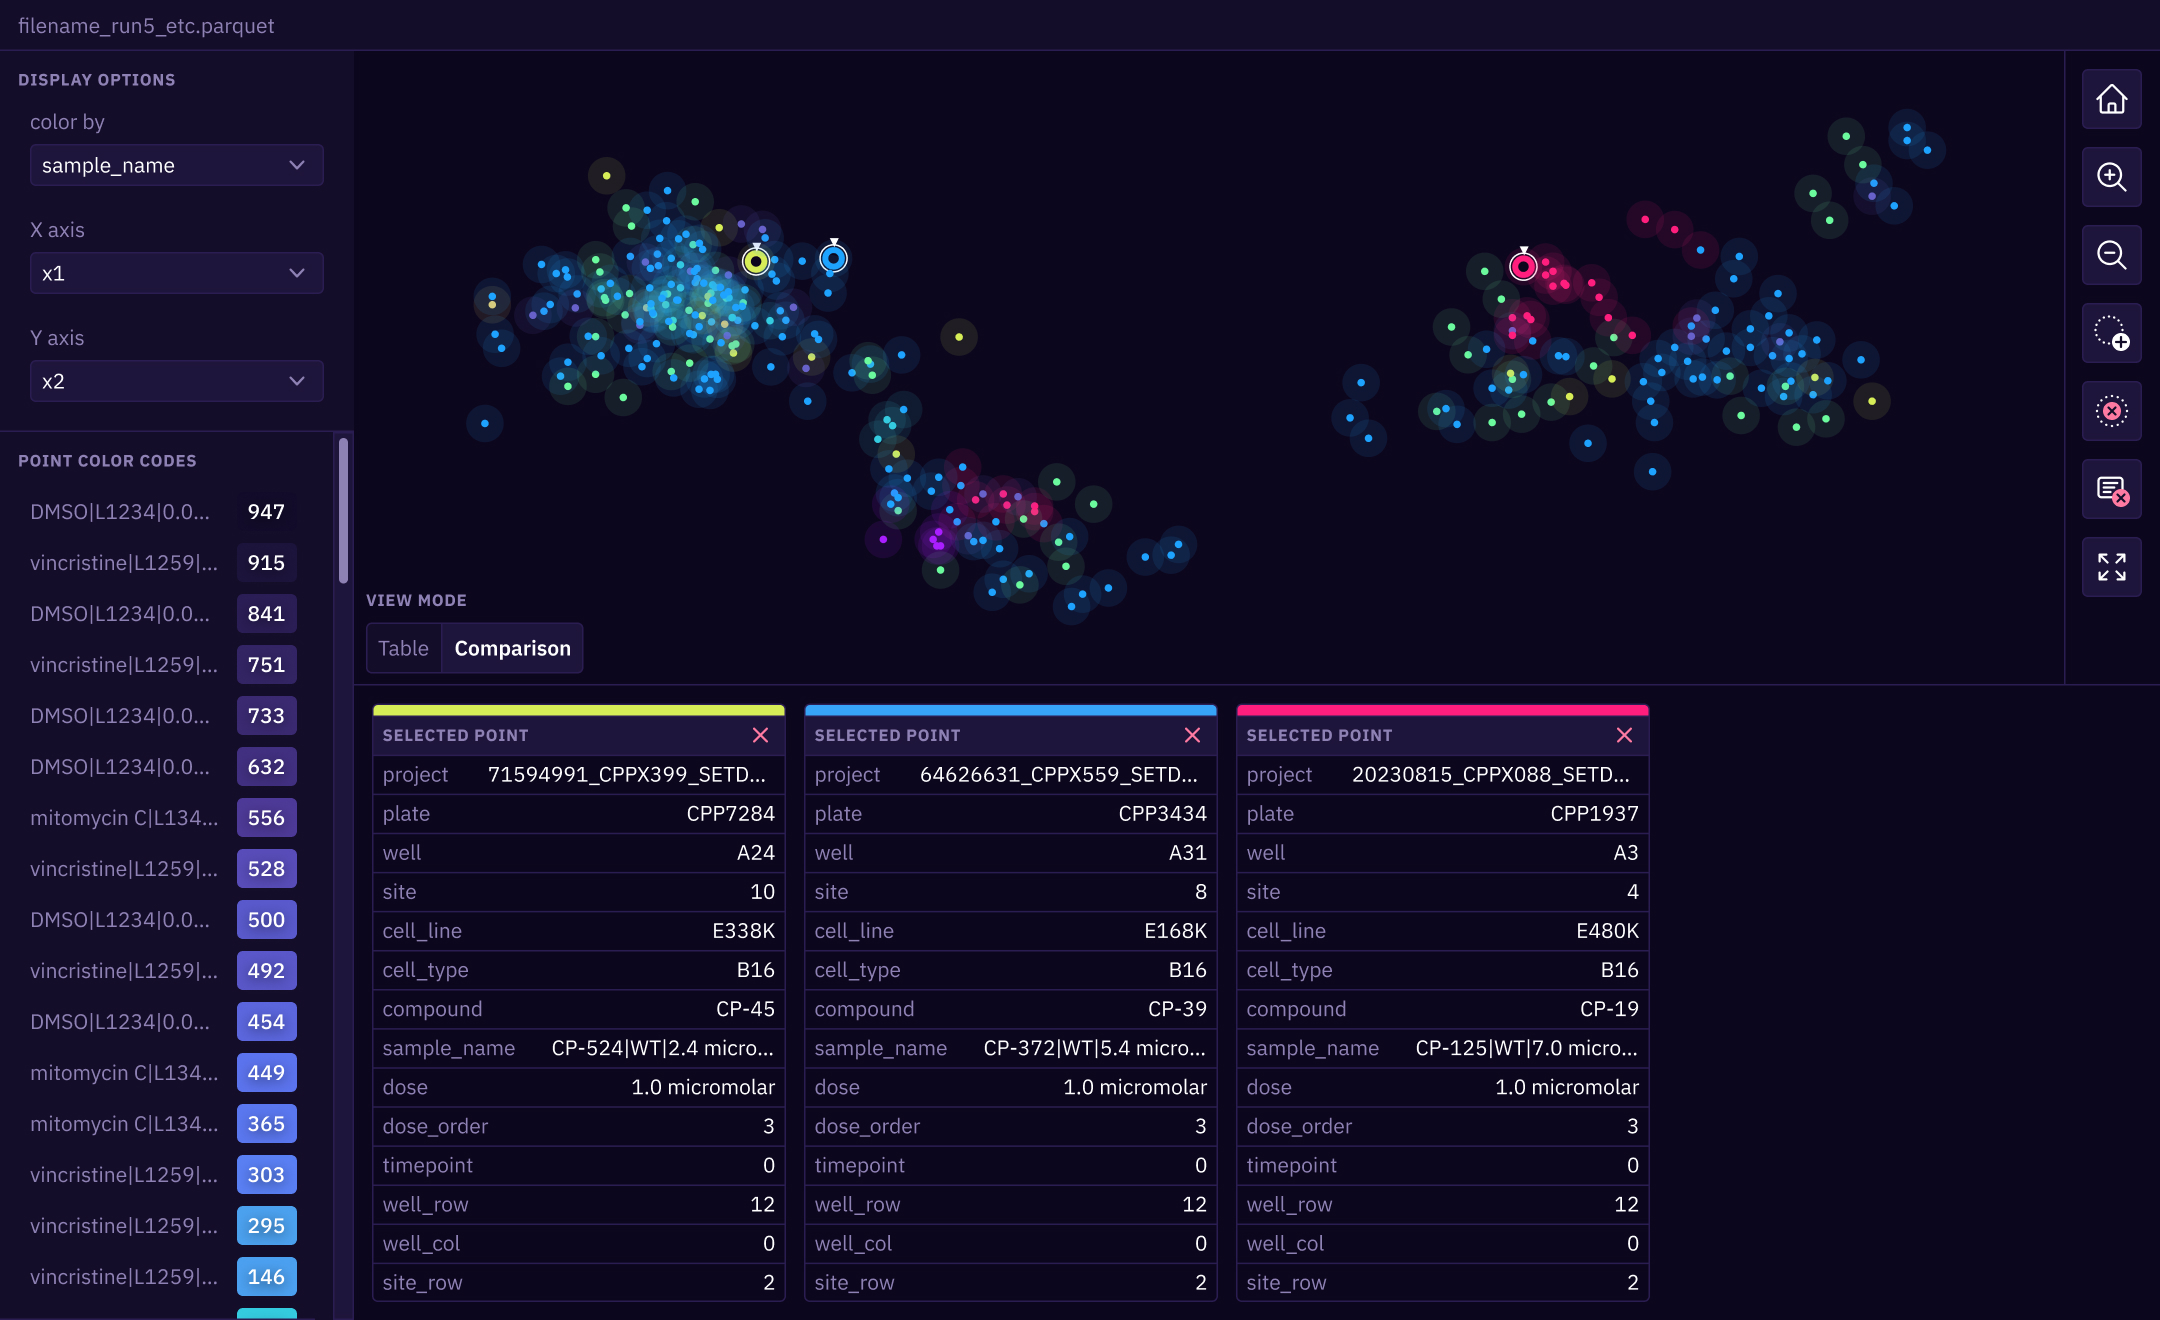
Data visualization is more than charts and dashboards: it’s about designing interactions that make information a living part of the product.
My approach comes from treating visualization as UI design that uses the full spatial dimension of an interface. Where BI reporting often isolates data in rigid dashboards, I focus on weaving visualizations directly into the core product experience. This means thinking about branding, interaction, responsiveness, and cohesion across components, not just numbers on a screen. I’ve found that this perspective helps bridge the gap between developers, data scientists, and product teams, ensuring that visualizations serve as both functional tools and brand assets.